
Drive revenue
Passive browsers become confident shoppers. Product pages actually become engaging. Conversion accelerates. Your revenue soars. Our solutions galvanize the entire shopper experience, allowing you to supercharge product performance.
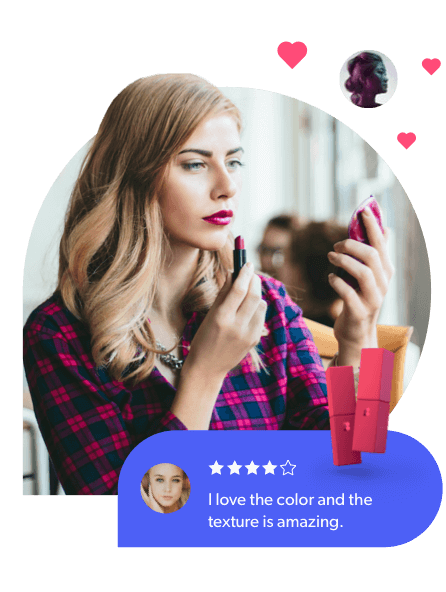
Harnessing the voice of the customer is more important than ever because shoppers trust other shoppers. Consumers seek out authentic user-generated content (UGC), context, and communities in their shopper journey – from awareness to purchase to loyalty. Inspire confident purchases with star ratings, consumer reviews, questions and answers, social content, sampling, creator and influencer marketing, and more. #findyourbazaarvoice
Whether it’s getting your user-generated content program started or expanding your content strategy, we’re here to be a true strategic partner for your business. Your brand, powered by Bazaarvoice, means smarter shopping for your customers – and business growth for you.
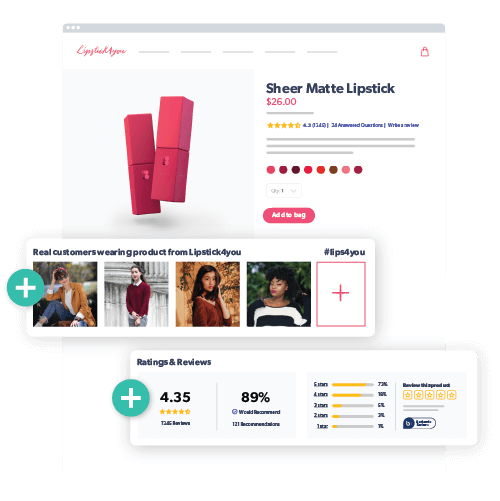
Leverage your customers’ authentic opinions, photos, and videos to boost sales. Get moderated ratings and reviews on your site and syndicated to your retailers. Shopper confidence, conversion, and traffic all take a spike. And you get to take a seat.
Inspire social browsers to become loyal brand buyers with top performing photos and videos from your social communities. Turn user-generated content into shoppable experiences that drive sales — wherever shoppers are. Tap into all of your existing, authentic social content. Bring inspirational content to your site. Sell on social. With Social Commerce, soar your sales with social content that converts.
Collect user-generated content to ensure a successful product launch. We’ll connect you with a targeted sampling community that thrives on creating content, and help you scale their great content across your product pages and retailers.


Great partnership, in depth dashboards, a ton of functionality is maintained with little code changes.
Major online retailer
Customers experienced a return of 400% over three years, and a payback on investment within three months.
Bazaarvoice is the leading user-generated content (UGC) platform for brands and retailers. Expand your reach globally with our retail syndication network, improve customer satisfaction with customer feedback, boost your sales through genuine customer reviews, and foster loyal advocates by providing shoppers with the information they need for confident purchases.

Capturing shoppers’ attention and standing out in a crowded market can be challenging when your marketing team (and budget) is on the lean side. Unlock your lean team’s full potential and do more with less by implementing a comprehensive UGC strategy.

Retailers who fully embrace social commerce can increase engagement, conversion, and revenue. This guide provides tips for quickly deploying a successful social commerce strategy that benefits both consumers and your brand.

This guide covers the essential elements of driving conversions by weaving social content throughout the shopper journey. It will also arm you with actionable tips on how to create powerful, captivating shopping experiences — and measure their impact on revenue.
Get in touch to find out which solutions will make the most impact for your business.Our helpful team of experts can answer your questions and talk everything from set up to ROI.
Request a demo